
Precision Longevity Blueprint
Your Precision Longevity Blueprint
i-screen’s Longevity Blueprint analyses hundreds of data points across metabolic regulation, mitochondrial efficiency, NAD⁺ status, inflammatory signalling, hormonal balance, nutrient sufficiency, detoxification capacity and advanced cardiovascular risk markers, providing an exceptionally detailed view of how your body is functioning beneath the surface.
By integrating these biomarkers into a single, cohesive framework, we build a precise and nuanced picture of what is accelerating, or protecting, your biological ageing. The result is a clear, personalised map of your physiology, translated into meaningful, easy-to-understand insights so you know exactly what your body needs to age well and maintain long-term vitality. Refer to our demo for an example set of test results.
What you get with your Longevity Blueprint
Comprehensive insight into your biology A deep analysis of over 230 metabolic, mitochondrial, cardiovascular, hormonal and inflammatory and markers to reveal what’s driving your biological ageing.
Your health data in one simple dashboard Track results, trends and improvements over time through your personalised Longevity Dashboard, bringing all key biomarkers together in one place.
Clarity on strengths and ageing accelerators Understand where your body is performing well, where early dysfunction is emerging, and which systems benefit most from targeted optimisation.
Personalised, evidence-based recommendations Receive clear, science-backed guidance across nutrition, supplements, lifestyle, sleep and stress to support healthier ageing.
What's included
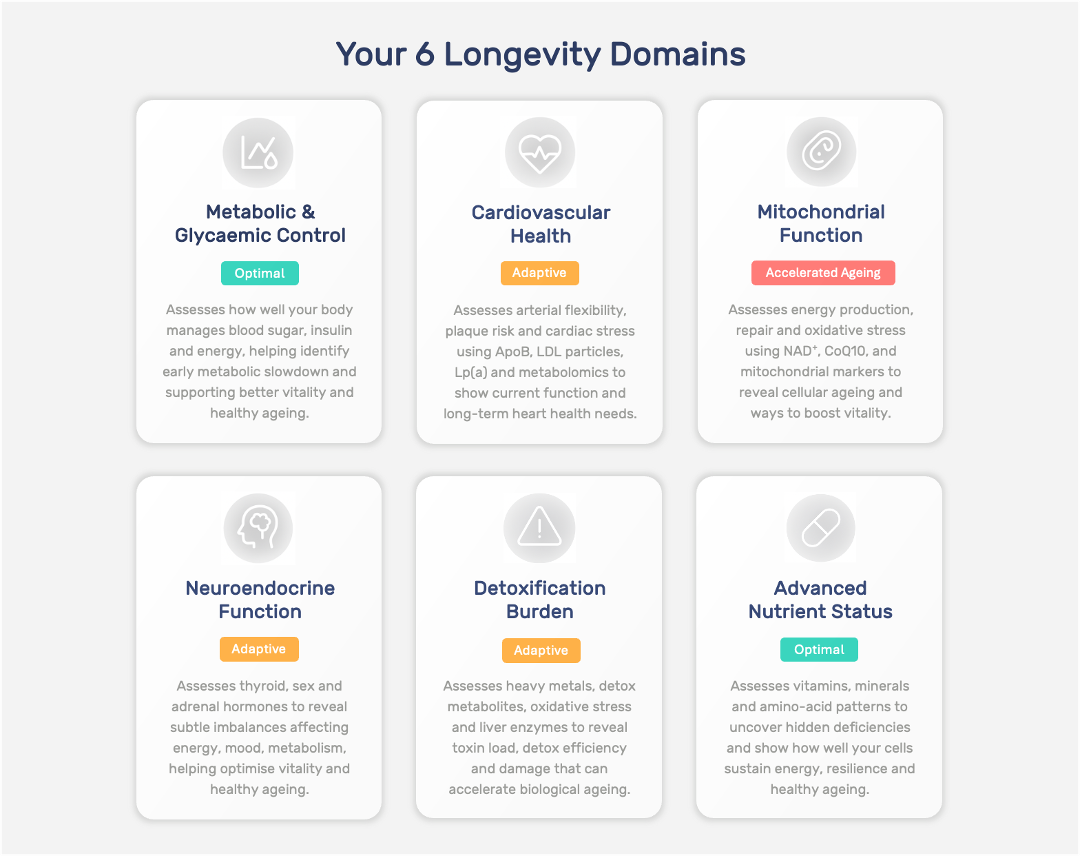
Your Longevity Blueprint turns advanced biomarkers and genetic insights into a clear, personalised roadmap for ageing well. It shows your biological age and key systems - metabolism, cardiovascular health, mitochondria, hormones, nutrients and detox capacity - highlighting where you’re thriving and where support is needed. Colour-coded domains make results easy to interpret, giving you a holistic view of your healthspan and the steps to enhance how you feel and function.
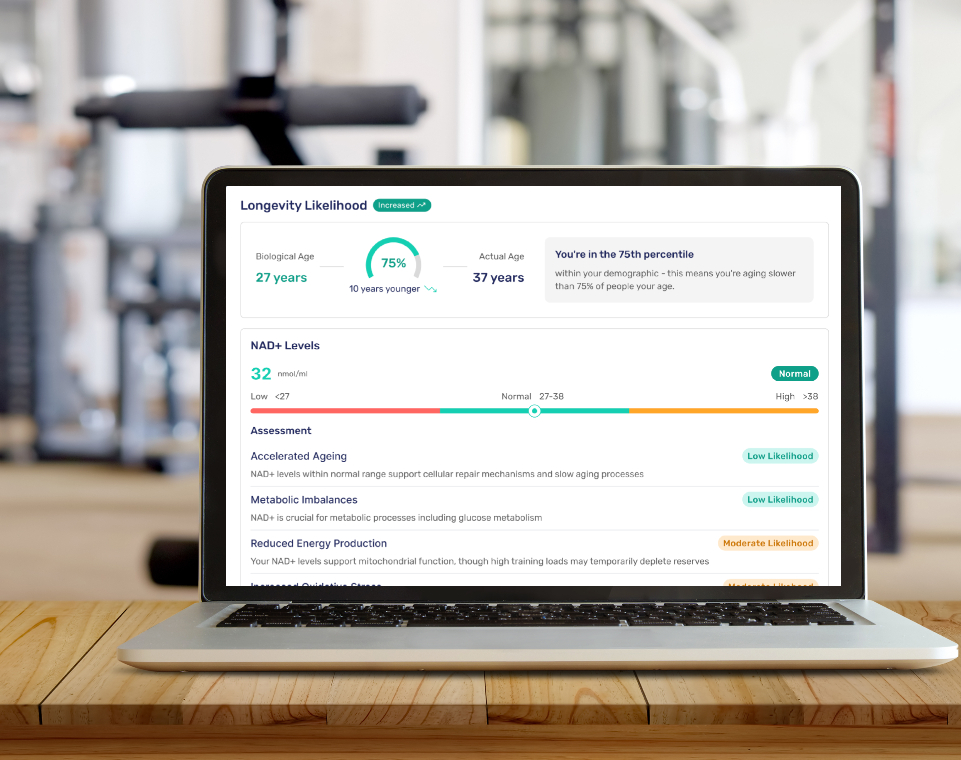
Longevity Likelihood combines advanced biomarkers including PhenoAge and NAD to reveal how your body is ageing beneath the surface. Get a clearer picture of your biological resilience, so you can take targeted steps to support energy, repair, and long-term health.
Metabolic & glycaemic control shows how efficiently your body regulates blood sugar, insulin and energy. Using markers like fasting insulin, HOMA-IR, triglycerides and glucose, we measure metabolic slowdown before symptoms appear. Improving this domain boosts energy, supports weight control, lowers inflammation and meaningfully impacts biological age.
Your heart and blood vessels age long before symptoms appear. By measuring ApoB, LDL particles, Lp(a) and metabolomic markers, we assess arterial flexibility, plaque risk and cardiac stress. This domain shows how well your cardiovascular system is functioning now and what changes can strengthen it for the future, supporting longevity and vitality.
Your Cellular Age measures how well your cells produce energy, repair damage and protect themselves from oxidative stress. We assess NAD⁺ status, CoQ10, glutathione demand, mitochondrial organic acids and markers of DNA oxidation to understand how efficiently your mitochondria and cellular repair systems are functioning. These insights show how rapidly your cells are ageing and where energy production or resilience may be under strain. Improving your Cellular and Mitochondrial Age boosts vitality, recovery, cognitive performance and long-term healthspan.
Hormones shape energy, metabolism, mood, sleep and resilience. By assessing thyroid function, sex hormones and adrenal signals, we reveal how well your endocrine system supports overall vitality. This domain highlights subtle imbalances that can accelerate ageing and shows how optimising hormonal balance can restore energy, clarity and metabolic performance.
This panel includes all heavy metals, detoxification pathway organic acids, oxidative stress markers, and liver enzymes which reflects glutathione-dependent detox capacity. Together, these markers map toxic exposure, internal detox efficiency, and oxidative damage, all of which accelerate biological ageing.
Micronutrients fuel energy production, detoxification, immunity and DNA repair. By measuring key vitamins, minerals and amino-acid patterns, we uncover hidden deficiencies or bottlenecks. This domain shows how well your cells generate energy, manage oxidative stress and support repair. Strengthening nutrient resilience boosts vitality and supports healthy ageing.
Test instructions

Download and print your pathology form from your i-screen dashboard.

Fast from all food and drink (other than water) for at least 8 hours, and no more than 12 hours prior to your test.

You’ll receive your venous blood draw test kit in the mail, along with logistics for your sample collection.
Ready. Set. Go!
Buy now for $1500

Common Questions
You may also be interested in
Lipoprotein Particle Test
Measure LDL particle number and size — advanced lipid markers beyond a standard cholesterol panel.
Advanced Lipid Test
Beyond basic cholesterol: measures ApoB, LDL particle size, lipoprotein(a) and 21 other advanced cardiac markers.
Coronary Calcium Score
A non-invasive CT scan that measures the amount of calcium (plaque) in your coronary arteries, producing a calcium score to discuss with your doctor.